User-defined spectra
This sections allows users to upload their own spectra to the server (experimental or simulation based on another data source) in order to compare them with the spectra obtained from HITRAN database for the same parameters.
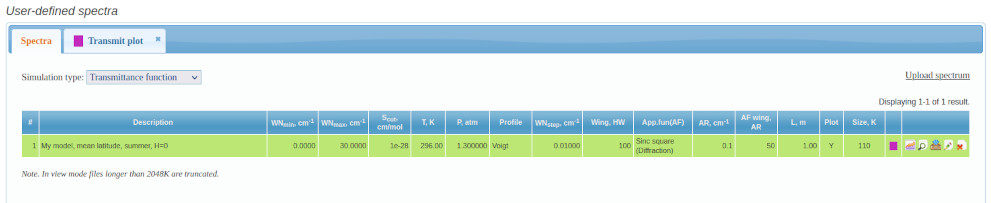
Fig. 1. The page of user-defined spectra
The section contains a set of tabs. The default Spectra tab shows the list of uploaded spectra. For each type of spectrum there is a table of available spectra. The table contains a description of each spectrum and the values of the parameters at which it was obtained.. The number of columns in the table depends on the type of spectrum, because different types of spectrum are described by different number of parameters.
In addition to the columns containing the values of the spectrum parameters, the table contains some additional columns. We describe them more detailed.
The Description column contains the type of gas mixture which the spectrum is obtained for.
The Plot column shows whether the graphical representation of the spectrum is available. The portal sites provide the ability of interactive manipulation with graphical data in the client browser. The attempt to build a plot for too large data file can cause the "hang" of the browser due to the long time required for building of the plot or exhausting the available RAM. The column can contain the values Y (Yes, the plot is available) or N (No, the plot is not available). Since there is a possibility of plotting several spectra, the choice of a number of spectra to plot may lead to similar results. According to our estimates, the total number of pairs of points (X,Y) for the plot should not exceed 500 thousand, although this limit can vary significantly depending on the parameter (primarily the amount of available RAM) of the user's computer.
The Size column specifies the file size in Kbytes.
The colored box in the next column used for visual identification of the spectrum.
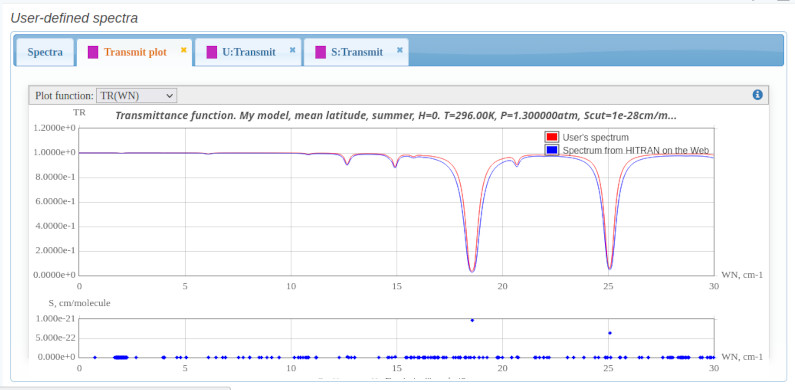
Fig. 2. Graphical comparison of the user-defined spectrum with the one obtained by modeling with the same parameters
The last column allows to perform some actions with the spectrum. It contains 5 buttons. The button ![]() opens a tab (Fig. 2) for comparing the graphs of the original spectrum and the spectrum obtained by modeling, The button
opens a tab (Fig. 2) for comparing the graphs of the original spectrum and the spectrum obtained by modeling, The button ![]() allows to open a tabs containing the numerical view of the user-defined spectrum (U) and and the spectrum obtained by modeling (S) (Fig. 3). The button
allows to open a tabs containing the numerical view of the user-defined spectrum (U) and and the spectrum obtained by modeling (S) (Fig. 3). The button ![]() is attended for download the text file containing the spectrum obtained by modeling (S) in numerical form. The button
is attended for download the text file containing the spectrum obtained by modeling (S) in numerical form. The button ![]() allows to edit a spectrum options. The button
allows to edit a spectrum options. The button ![]() allows you to delete a spectrum.
allows you to delete a spectrum.
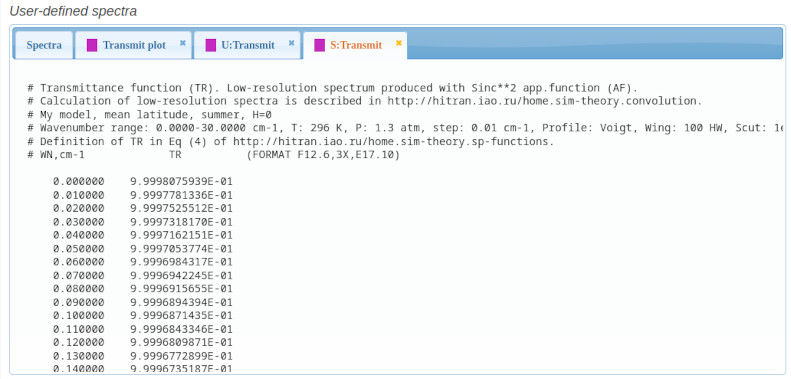
Fig.3. Numerical representation of the user-defined spectrum and the spectrum obtained by simulation under the same parameters
Before uploading the file with spectrum the user need to fill the form (Fig. 4) with values of parameters at which this spectrum is obtained. All user-defined spectra are considered as gas mixture spectra so the user must prepare his own gas mixture for uploaded spectrum if it does not exist among predefined or user defined mixtures.The set of user spectrum parameters of user-defined spectrum depends on its type.
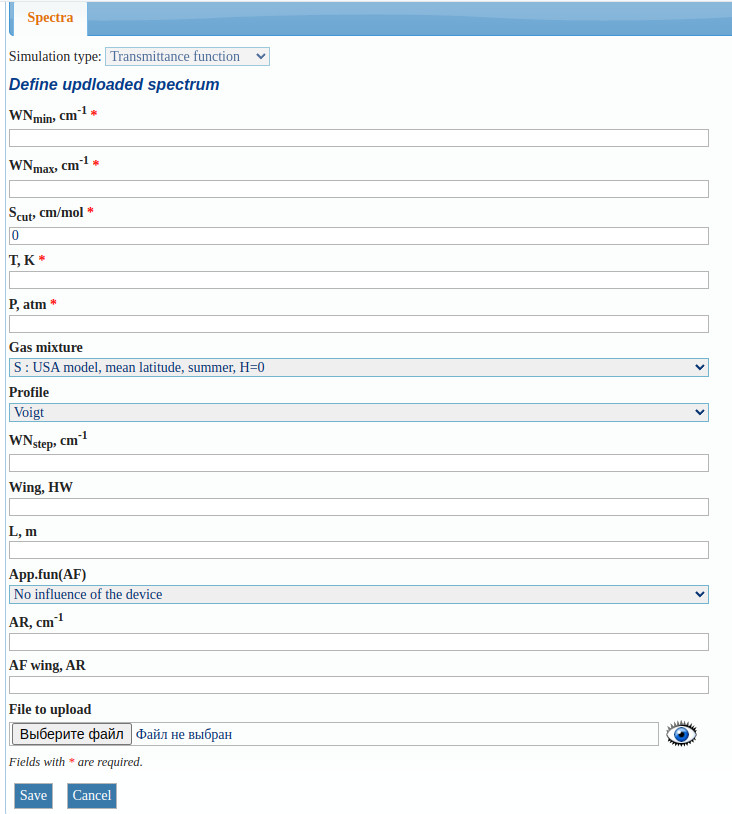
Fig. 4. The form for setting user spectrum parameters and loading it
Format of numerical data
Numeric files loaded by the user usually contain 2 columns, a wavenumber column and a loaded spectral function value column. Data files for Absorption coefficients and Absorption cross-sections spectra may contain 3rd column for Ka [cm2/molecule] and absorbance A [ppm-1·m-1] respectively.Numerical files obtained by modelling usually contain several header lines starting with " # " character, which give a verbal description of the contents of the file and the parameter values of the simulated spectrum. Below are the data columns. For spectral functions the data contains 2 or 3 columns. The first one is the wavenumber WN, and the rest are value(s) of appropriate spectral function. In the case of a list of spectral lines also known as linelist the file contains multiple columns. Each column contains values of one of parameter of spectral line described in the Generalities section. Currently two file formats of the linelist are supported: HITRAN-2004 and SPECTRA. Consult to Generalities/Numerical representation of the results for more detaild information.